
Ai Content Generator
Ai Picture
Tell Your Story

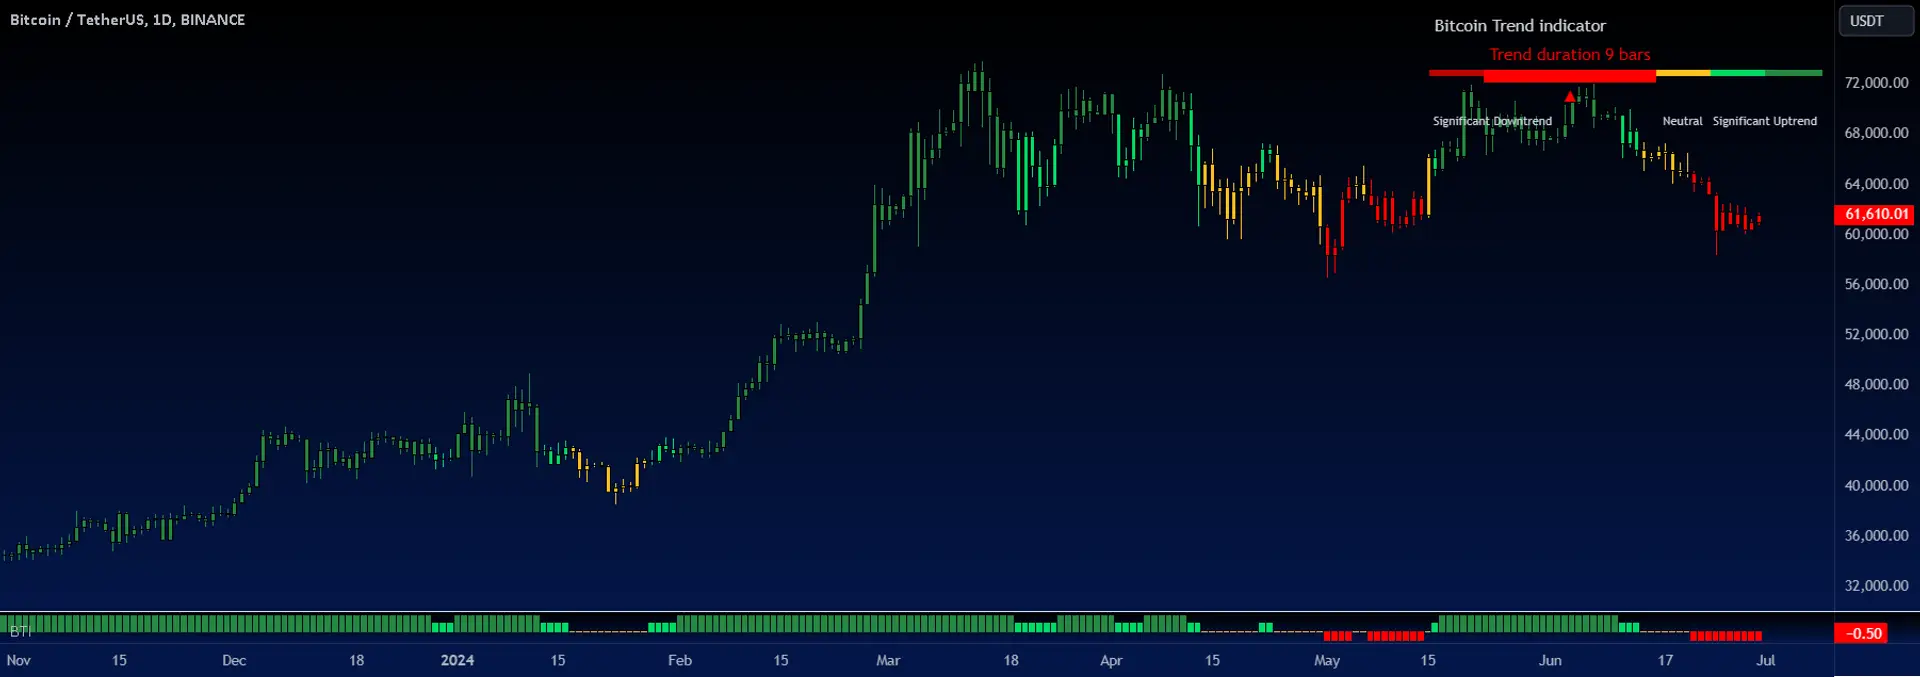
Bitcoin trend line.
Bitcoin, as the leading cryptocurrency, exhibits significant price movements that traders and investors closely analyze. One of the most effective tools for analyzing these movements is the trend line.
What is a Trend Line?
A trend line is a straight line that connects two or more price points on a chart and extends into the future. It serves as a visual representation of the direction in which the price of an asset is moving. In the context of Bitcoin, trend lines can help identify potential support and resistance levels.
Types of Trend Lines
- Uptrend Line: This line is drawn by connecting the lows of the price action, indicating that the price is moving upward. An uptrend line suggests bullish sentiment among traders.
- Downtrend Line: Conversely, this line connects the highs of the price action, indicating a downward movement. A downtrend line reflects bearish sentiment.
- Horizontal Trend Line: This line is drawn when the price is moving sideways, indicating consolidation. It can act as a support or resistance level.
How to Draw a Trend Line
To draw a trend line for Bitcoin, follow these steps:
- Select a time frame (daily, weekly, hourly) based on your trading strategy.
- Identify at least two significant price points (highs or lows) that you want to connect.
- Use a charting tool to draw a line through these points, extending it into the future.
Example of a Bitcoin Uptrend
In 2020, Bitcoin experienced a significant uptrend, starting from around $3,800 in March and reaching approximately $64,000 in April 2021. By drawing an uptrend line connecting the lows from March to subsequent months, traders could identify the bullish movement and make informed decisions about buying or holding Bitcoin.
Example of a Bitcoin Downtrend
Conversely, in May 2021, Bitcoin's price fell from its all-time high of nearly $64,000 to around $30,000 by July. A downtrend line could be drawn by connecting the highs during this period, signaling to traders that the market was in a bearish phase, prompting them to reconsider their positions.
Using Trend Lines in Trading Strategies
Trend lines can be integrated into various trading strategies:
- Breakout Trading: Traders often look for breakouts above a downtrend line or below an uptrend line as a signal to enter a trade.
- Reversal Trading: A bounce off a trend line can indicate a reversal in price direction, providing potential entry points for traders.
Limitations of Trend Lines
While trend lines are useful, they are not foolproof. Market conditions can change rapidly, and false breakouts can occur. It is essential to combine trend lines with other technical indicators, such as moving averages or RSI (Relative Strength Index), to improve the accuracy of predictions.
Conclusion
Trend lines are a fundamental tool in technical analysis for Bitcoin and other cryptocurrencies. By understanding how to draw and interpret these lines, traders can make more informed decisions in the highly volatile crypto market. For further reading, consider resources like CoinDesk and Investopedia, which provide valuable insights into cryptocurrency trends and trading strategies.
Related Posts
© 2025 Invastor. All Rights Reserved
User Comments